
Know your visitors
How many pass, how many enter, when they come, and aggregate demographics per door and zone.
People counting & visitor analytics
See the full visitor journey: from corridor, to storefront, into zones, to checkout. One visitor counter dashboard every team can read.
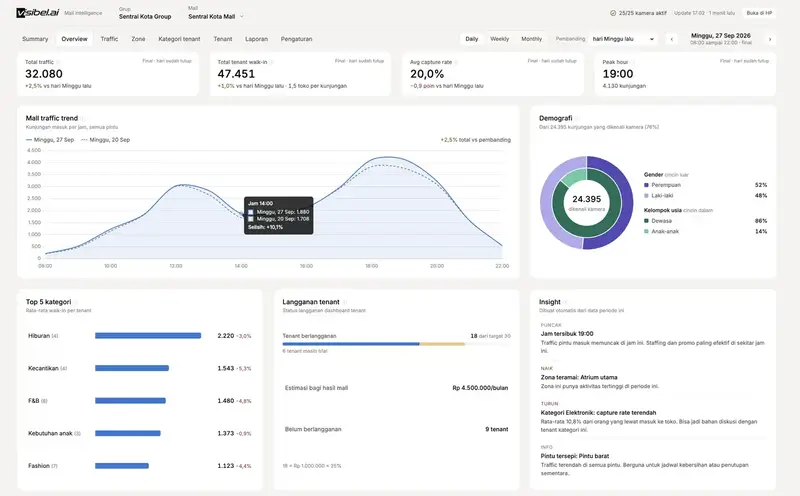
Traffic, tenant walk-in, capture rate, peak hour, and auto insights on one screen.
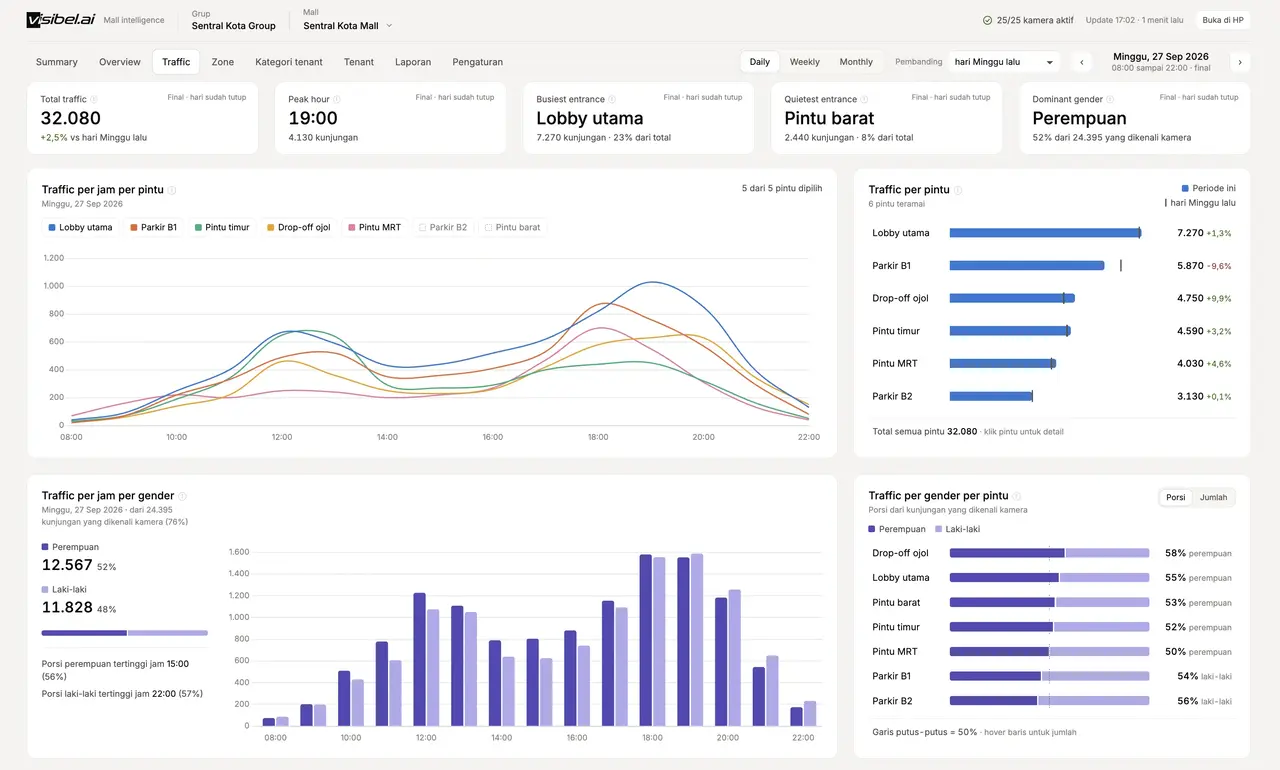
Hourly traffic per entrance, busiest and quietest doors, vs previous periods.
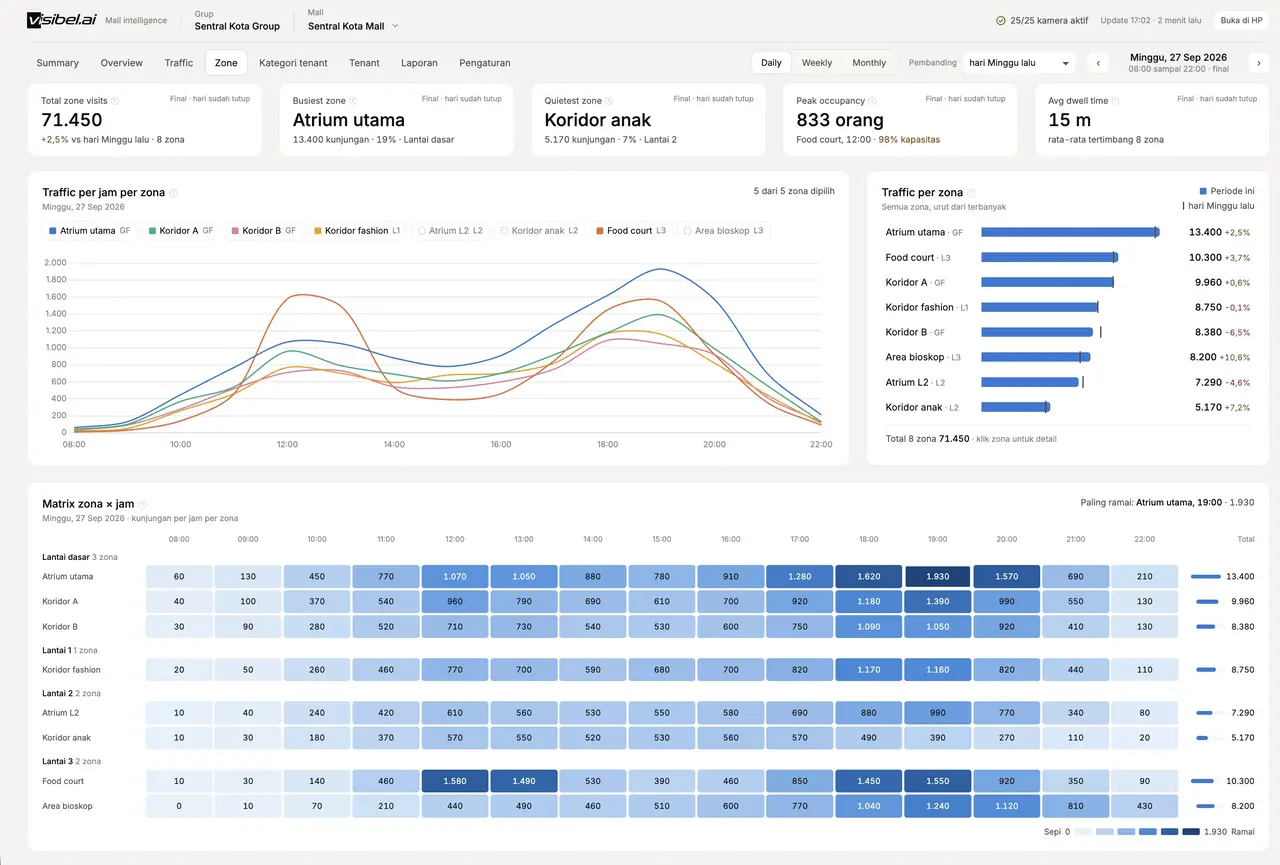
Zone visits, peak occupancy, dwell time, and zone × hour matrix.
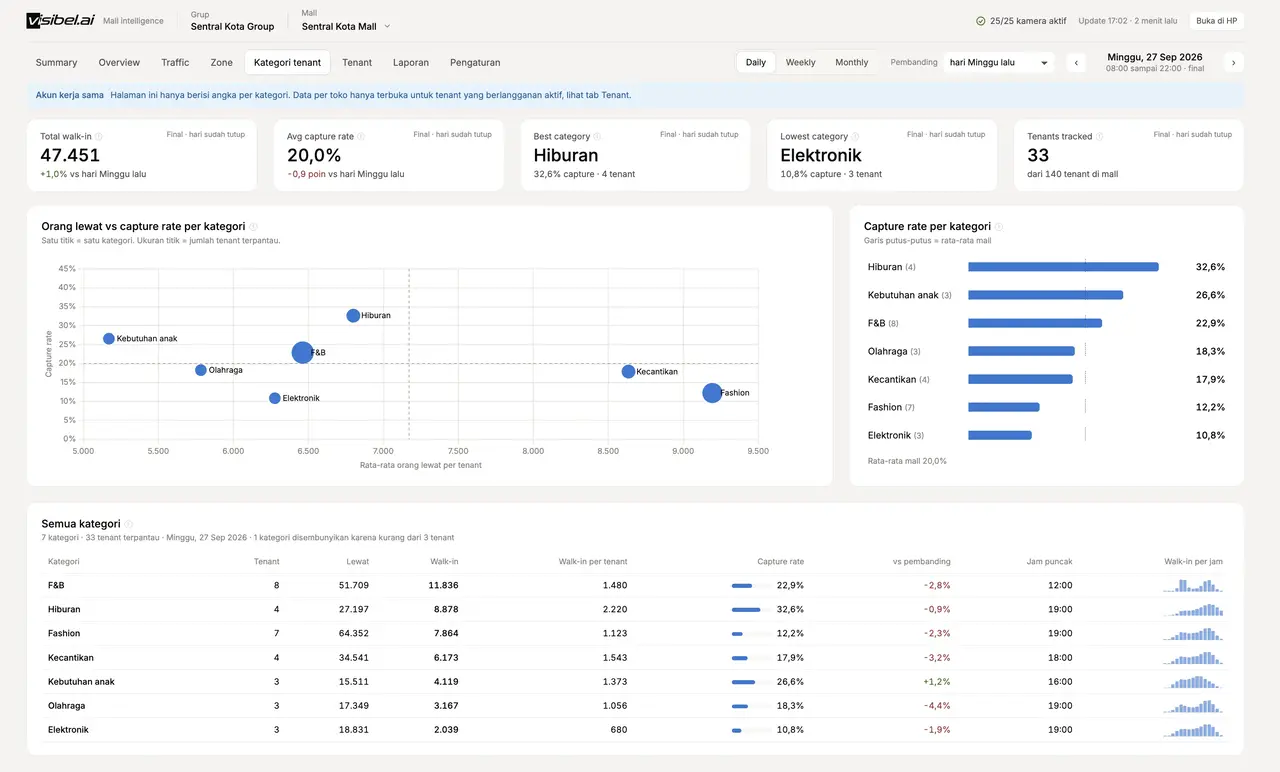
Passer-by vs capture rate by category, best & lowest, and hourly walk-in.
Dashboard with sample data.
Trusted by malls and retailers in Indonesia








Outcomes
How many pass, how many enter, when they come, and aggregate demographics per door and zone.
From corridor to storefront, into zones, to checkout. See which step leaks.
Compare periods, measure events and layout changes, then decide whether to continue.
Beyond door counters
Door sensors give one number: entries. visibel.ai reads existing CCTV with computer vision and adds context around it · without new counters at every door.
People counter
visibel.ai adds
What you measure
Metrics e-commerce teams use · now for your mall and stores.
Traffic
Zones
Tenant & store
APIs for BI, POS, CRM/ERP, or leasing systems. We can push data, or you pull. POS integration adds conversion and transaction value.
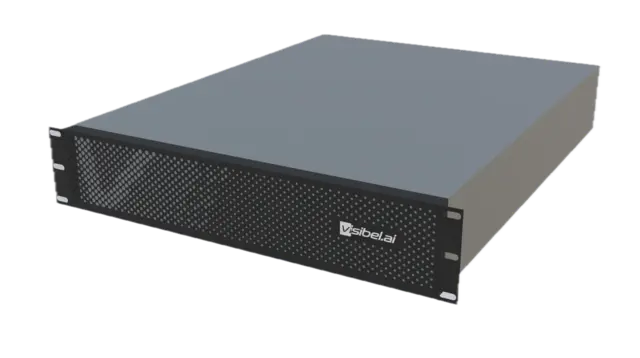
Plug-and-play hardware: power on, connect to the network, then the visibel.ai team configures counting lines, zones, and corridors. The next site follows the same pattern.
AI on-premise
Instead of sending video to the cloud (heavy bandwidth, unstable connections, leak risk), analyze locally. visibel.ai brings AI to your building: edge device or on-site server connected to existing CCTV. Video is processed on-site; only numbers leave.
Cloud-based analytics
visibel.ai AI on-premise
CCTV video
Stream sent to third-party servers for analysis
Analyzed in your building. Video never leaves
Bandwidth
Continuous video upload from every camera
Only aggregate numbers are sent · lightweight
When internet fails
Analytics are disrupted too
Processing keeps running on-site
Data control
Data sits on vendor infrastructure, often abroad
Stays in your server room · easier PDP alignment
Scale
Cost and network load grow with every camera
300+ channels monitored, still processed locally
Door counters only count entries. visibel.ai adds passer-by, capture rate, zones, dwell time, peak hour, tenants, and period comparison · from existing CCTV, no extra sensors, processed on-premise.
Management, leasing, marcomm, operations, and optionally tenants via tenant portal. Each person sees locations relevant to them.
Yes. APIs integrate with internal systems, BI, or POS. We can push data, or you can pull it.
Each site has its own hardware (VE edge or VP server) processing video locally. All sites appear in one dashboard with the same metrics.
Visitors already came. CCTV already saw them. Start a free trial and see the numbers yourself · no camera swap, no video leaving the building.
Trials are prioritized for sites in Jabodetabek that pass CCTV readiness assessment.